INTRODUCTION
The neurolytic celiac plexus block is a well-established intervention to palliate pain originating from pancreatic cancer and can potentially improve the quality of life of patients.1 The most frequent indication for celiac plexus neurolysis (CPN) is pain secondary to an upper abdominal malignancy, specifically pancreatic cancer, although it is also effective for pain generated by retroperitoneal tumors or metastases.1,2 Recently, endoscopic ultrasound (EUS)-CPN was developed. The side effects of this procedure include orthostatic hypotension, diarrhea, alcoholic neuritis, and retroperitoneal hemorrhage.3 We present a patient who developed hepatic and splenic infarction and bowel ischemia following EUS-guided CPN.
CASE REPORT
The patient was a 69-year-old man with a history of small cell lung cancer with pancreatic metastasis. He received radiotherapy and chemotherapy, which were completed in September 2011. He suffered from debilitating, significant epigastric pain for several weeks before being offered CPN.
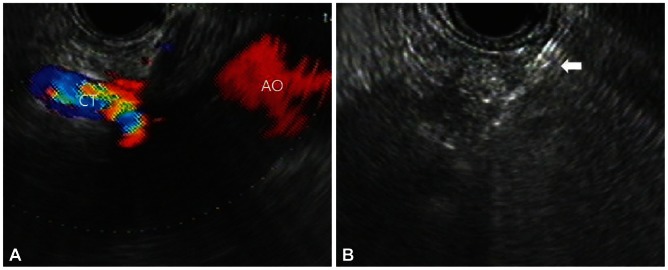
The procedure was performed under direct EUS visualization with linear array endosonography (Linear EUS Olympus GF-UCT240; Olympus, Tokyo, Japan) used to obtain sagittal views of the celiac trunk. The needle was inserted via the transgastric approach, under EUS guidance, immediately anterosuperior to the takeoff of the celiac trunk. Color Doppler EUS procedure was performed to rule out vessel penetration. After insertion of a 22-gauge needle, an aspiration test was performed in front of the celiac trunk with no blood return, and then 5 mL of 0.25% bupivacaine, 10 mL of dehydrated 98% ethanol, 1 mL of triamcinolone acetonide, and 3 mL of normal saline were injected gradually (Fig. 1).
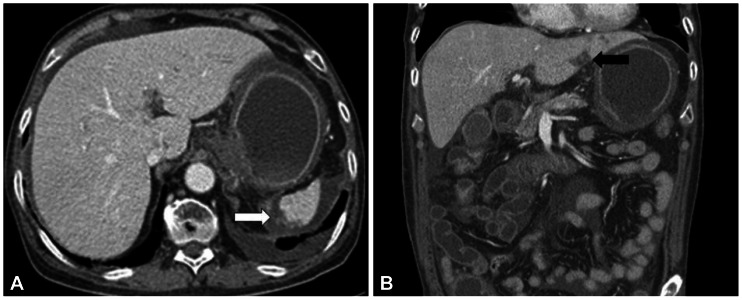
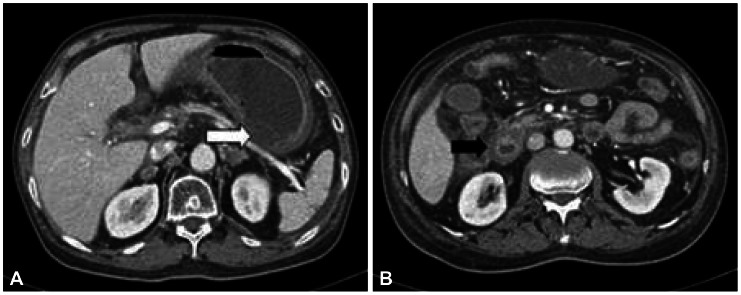
On postoperative day (POD) 1, the patient complained of recurrent abdominal pain, abdominal distension, nausea, and vomiting. On POD 5, a 38т high fever developed. Abdominal computed tomography revealed infarction of the left lateral segment of the liver and spleen and ischemia of the stomach and proximal small bowels (Figs. 2, 3). On POD 6, bloody diarrhea and hematemesis were observed. On esophagogastroduodenoscopy (EGD), diffuse erythematous, edematous, exudative, and hemorrhagic mucosal changes were noted on the body and multiple gastric ulcers were noted in the antrum without active bleeding (Fig. 4). Hemorrhagic duodenitis and a duodenal ulcer were also visualized. Oral feedings were withheld from the patient, followed by treatment using a proton pump inhibitor and sustained total parenteral nutrition. There was no further hematemesis or hematochezia. The patient continued to suffer from abdominal pain, which improved only partially; it could not be controlled with a continuous intravenous infusion of morphine and use of a fentanyl patch. On POD 12, EGD still showed hemorrhagic gastritis with necrotic debris on the posterior wall of the body and revealed healing stage gastric ulcers on the antrum (Fig. 5). The patient continued to suffer from abdominal pain, nausea, vomiting, and bloody diarrhea. He died 27 days following CPN due to multiorgan failure and sepsis despite best supportive care.
DISCUSSION
This report presents a patient who was suffering from abdominal pain secondary to pancreatic metastasis of small cell lung cancer. He underwent palliative CPN for abdominal pain and subsequently developed hemorrhagic gastritis and duodenitis as well as infarction of the liver and spleen.
Similar cases have been previously reported. In one case report, the patient developed splenic infarction and gastric ischemia following EUS-guided CPN.4 In another case report, the patient developed hemorrhagic gastritis and duodenitis after EUG-guided CPN.1
It is difficult to offer a precise physiologic explanation for this complication. We speculate that inhibition of sympathetic tone resulting from CPN potentially opened the "floodgates" of unopposed parasympathetic activity,1,5 which causes increased acid secretion and blood flow to the gastrointestinal (GI) system, ultimately unmasking indolent hemorrhagic gastritis and duodenitis. Therefore, it may be beneficial for patients with a history of gastritis, duodenitis, or GI bleeding to undergo a careful upper GI evaluation before CPN.1 Upper GI bleeding can result in the passage of bright red blood from the rectum if the enteral transit time is rapid, which likely occurred in this case. The infarction of the liver, spleen, stomach, and proximal small bowel suggests that an ischemic injury occurred during the procedure. In this case we performed color Doppler EUS and an aspiration test prior to CPN. And only after confirming that there was no penetration of blood vessels was ethanol injected in front of the celiac trunk. We postulate that the diffusion of ethanol into the celiac artery and subsequent vasospasm resulted in the injury pattern. At nontoxic concentrations, ethanol can produce vasoconstriction severe enough to cause vascular and smooth muscle cell death.4,6
One meta-analysis found that the most common adverse effects of CPN are local pain (96%), transient diarrhea (44%), and hypotension (38%).7 Severe adverse effects are uncommon (2%) and include paralysis, paresthesia, prolonged diarrhea, renal puncture, and pneumothorax. Another meta-analysis of EUS-guided CPN for pain due to chronic pancreatitis or pancreatic cancer pain demonstrated that the rate of complications was very low with CPN using EUS as a tool compared with radiologic guidance.8 No neurological complication has been reported in EUS-guided CPN studies. Other studies have found that EUS-guided CPB and CPN are reasonably safe procedures with tolerable side-effect profiles and low overall complication rates.3,8


